
ANA - Agricultural Nutrient Assistant
Save on inputs today. Build the primary data your supply chain needs tomorrow.
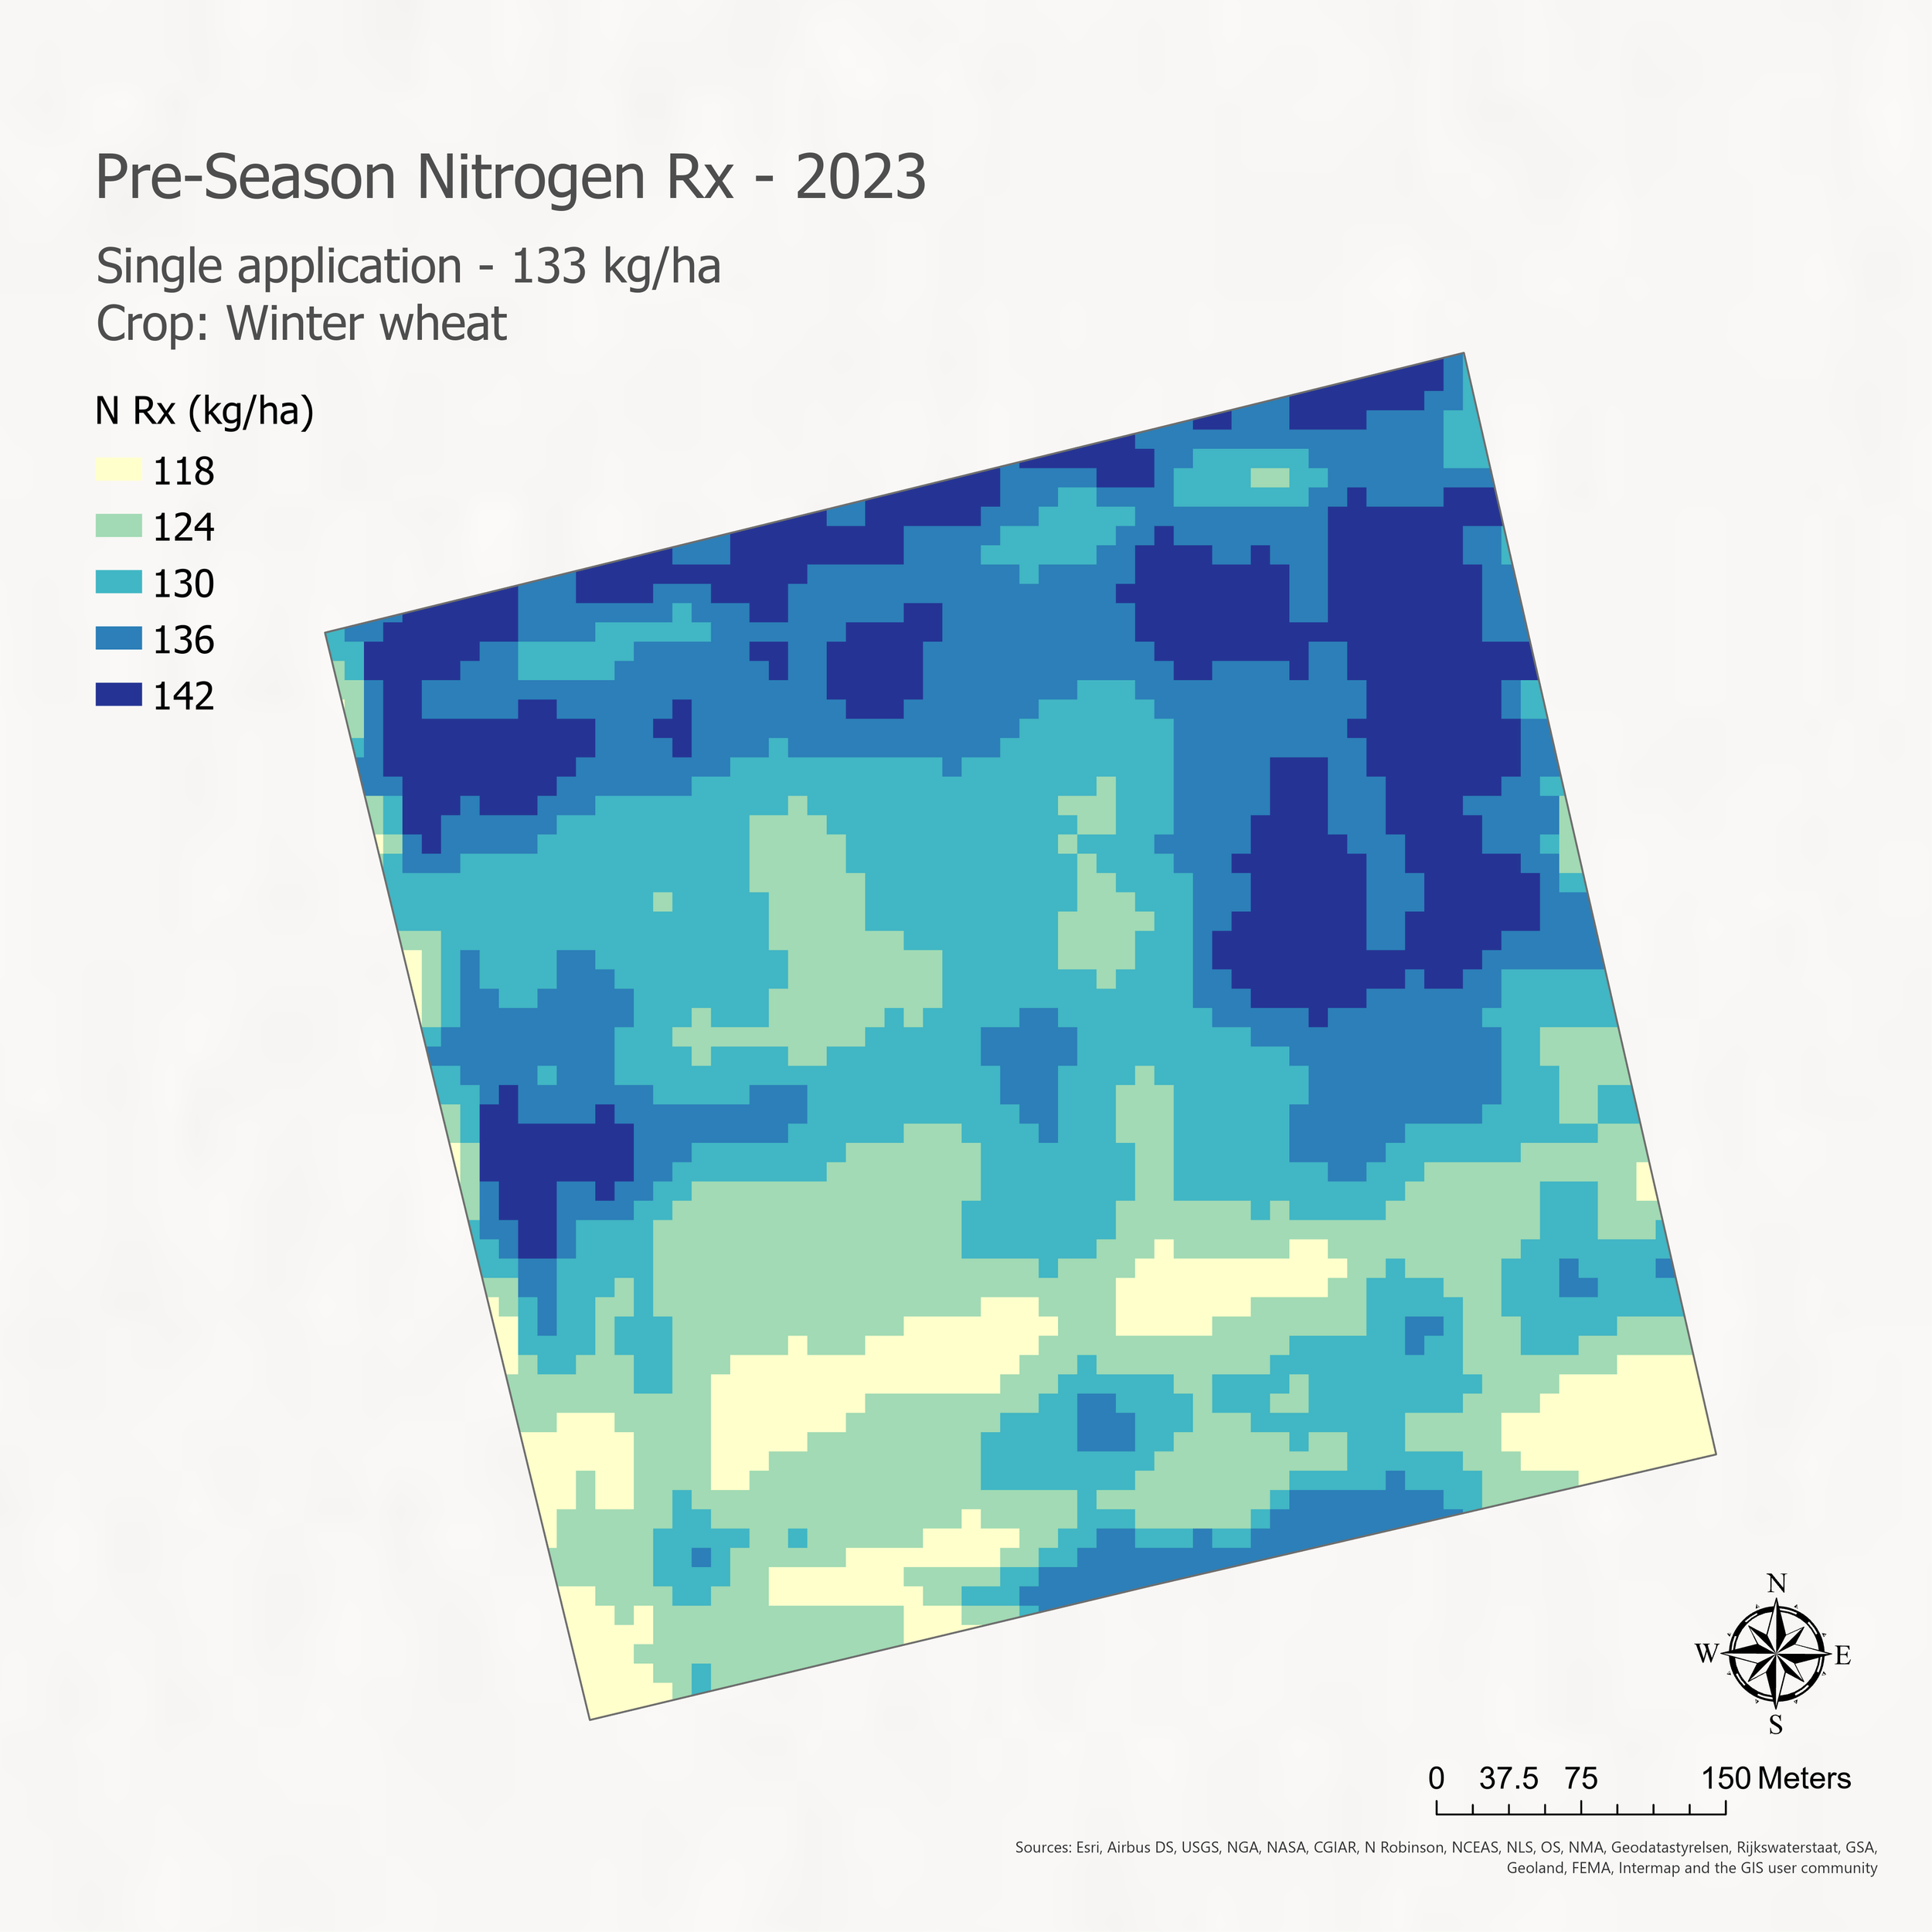
ANA, the Agricultural Nutrient Assistant, produces satellite-calibrated variable-rate nitrogen recommendations. Sentinel-2 imagery maps canopy variability, and a geotagged smartphone photograph calibrates that relative index into absolute nutrient values in kilograms per hectare, with no soil or tissue test required. Farmers gain an average of €28 per hectare with no practice change and no cost to them. Every recommendation and application map is logged, producing primary farm-level nitrogen data. ANA is Step 1 of RegenScope3, not a standalone precision farming product.
ANA is Step 1 of RegenScope3. See the full programme →
ANA IS STEP 1 OF REGENSCOPE3
The most reliable way to build a primary data asset at supply chain scale is to make it worth the farmer's while.
Most supply chain sustainability programmes start with a compliance request. Farmers receive a survey, a portal login, or a data-sharing agreement. Engagement is low. Data quality is poor. The primary data never materialises.
ANA works the other way around. Farmers benefit first - through nitrogen savings that reduce input costs immediately, with no change to how they farm. As they use ANA, verified field data enters your supply chain voluntarily. That data becomes the foundation for your GHG Protocol LSR compliance, your CSRD Scope 3 disclosure, and your SBTi FLAG target-setting.
The farmer gains before being asked for anything, which is what makes the evidence relationship possible at supply chain scale.
HOW IT WORKS
Three steps from satellite to savings.
Satellite Analysis
Spacenus analyses Sentinel-2 multispectral satellite imagery to map canopy reflectance and biomass variability across every zone of the field. This produces a relative nutrient index - high spatial resolution, updated with each satellite pass.




Smartphone field calibration
The farmer or agronomist takes geotagged smartphone photos of the plant canopy. This calibrates the relative index into absolute nutrient values (kg/ha). The calibration is a technical first - developed across multiple ESA-funded projects.

Recommendation delivered
ANA generates plant-need-based nitrogen recommendations. The output is ready for VRA equipment. ANA tracks total applied nitrogen across the season and writes it to the field record (PDCT), tractor application maps double as verification evidence.
WHAT ANA DELIVERS
Every output serves two purposes: farmer value and supply chain proof.
| Output | Description |
|---|---|
| Variable-Rate Nitrogen Maps | Field-zone level nitrogen application maps based on satellite + smartphone calibration. Segmented by canopy variability zone. Output: PDF map + VRA-compatible file. Aligned with fertiliser regulation limits. |
| Nutrient Deficiency Maps | Relative and absolute nutrient deficiency maps per field zone. Identifies under- and over-application areas. Enables targeted intervention before crop stress is visible. Available for nitrogen primarily; historical capability across N, P, K, S, Mg. |
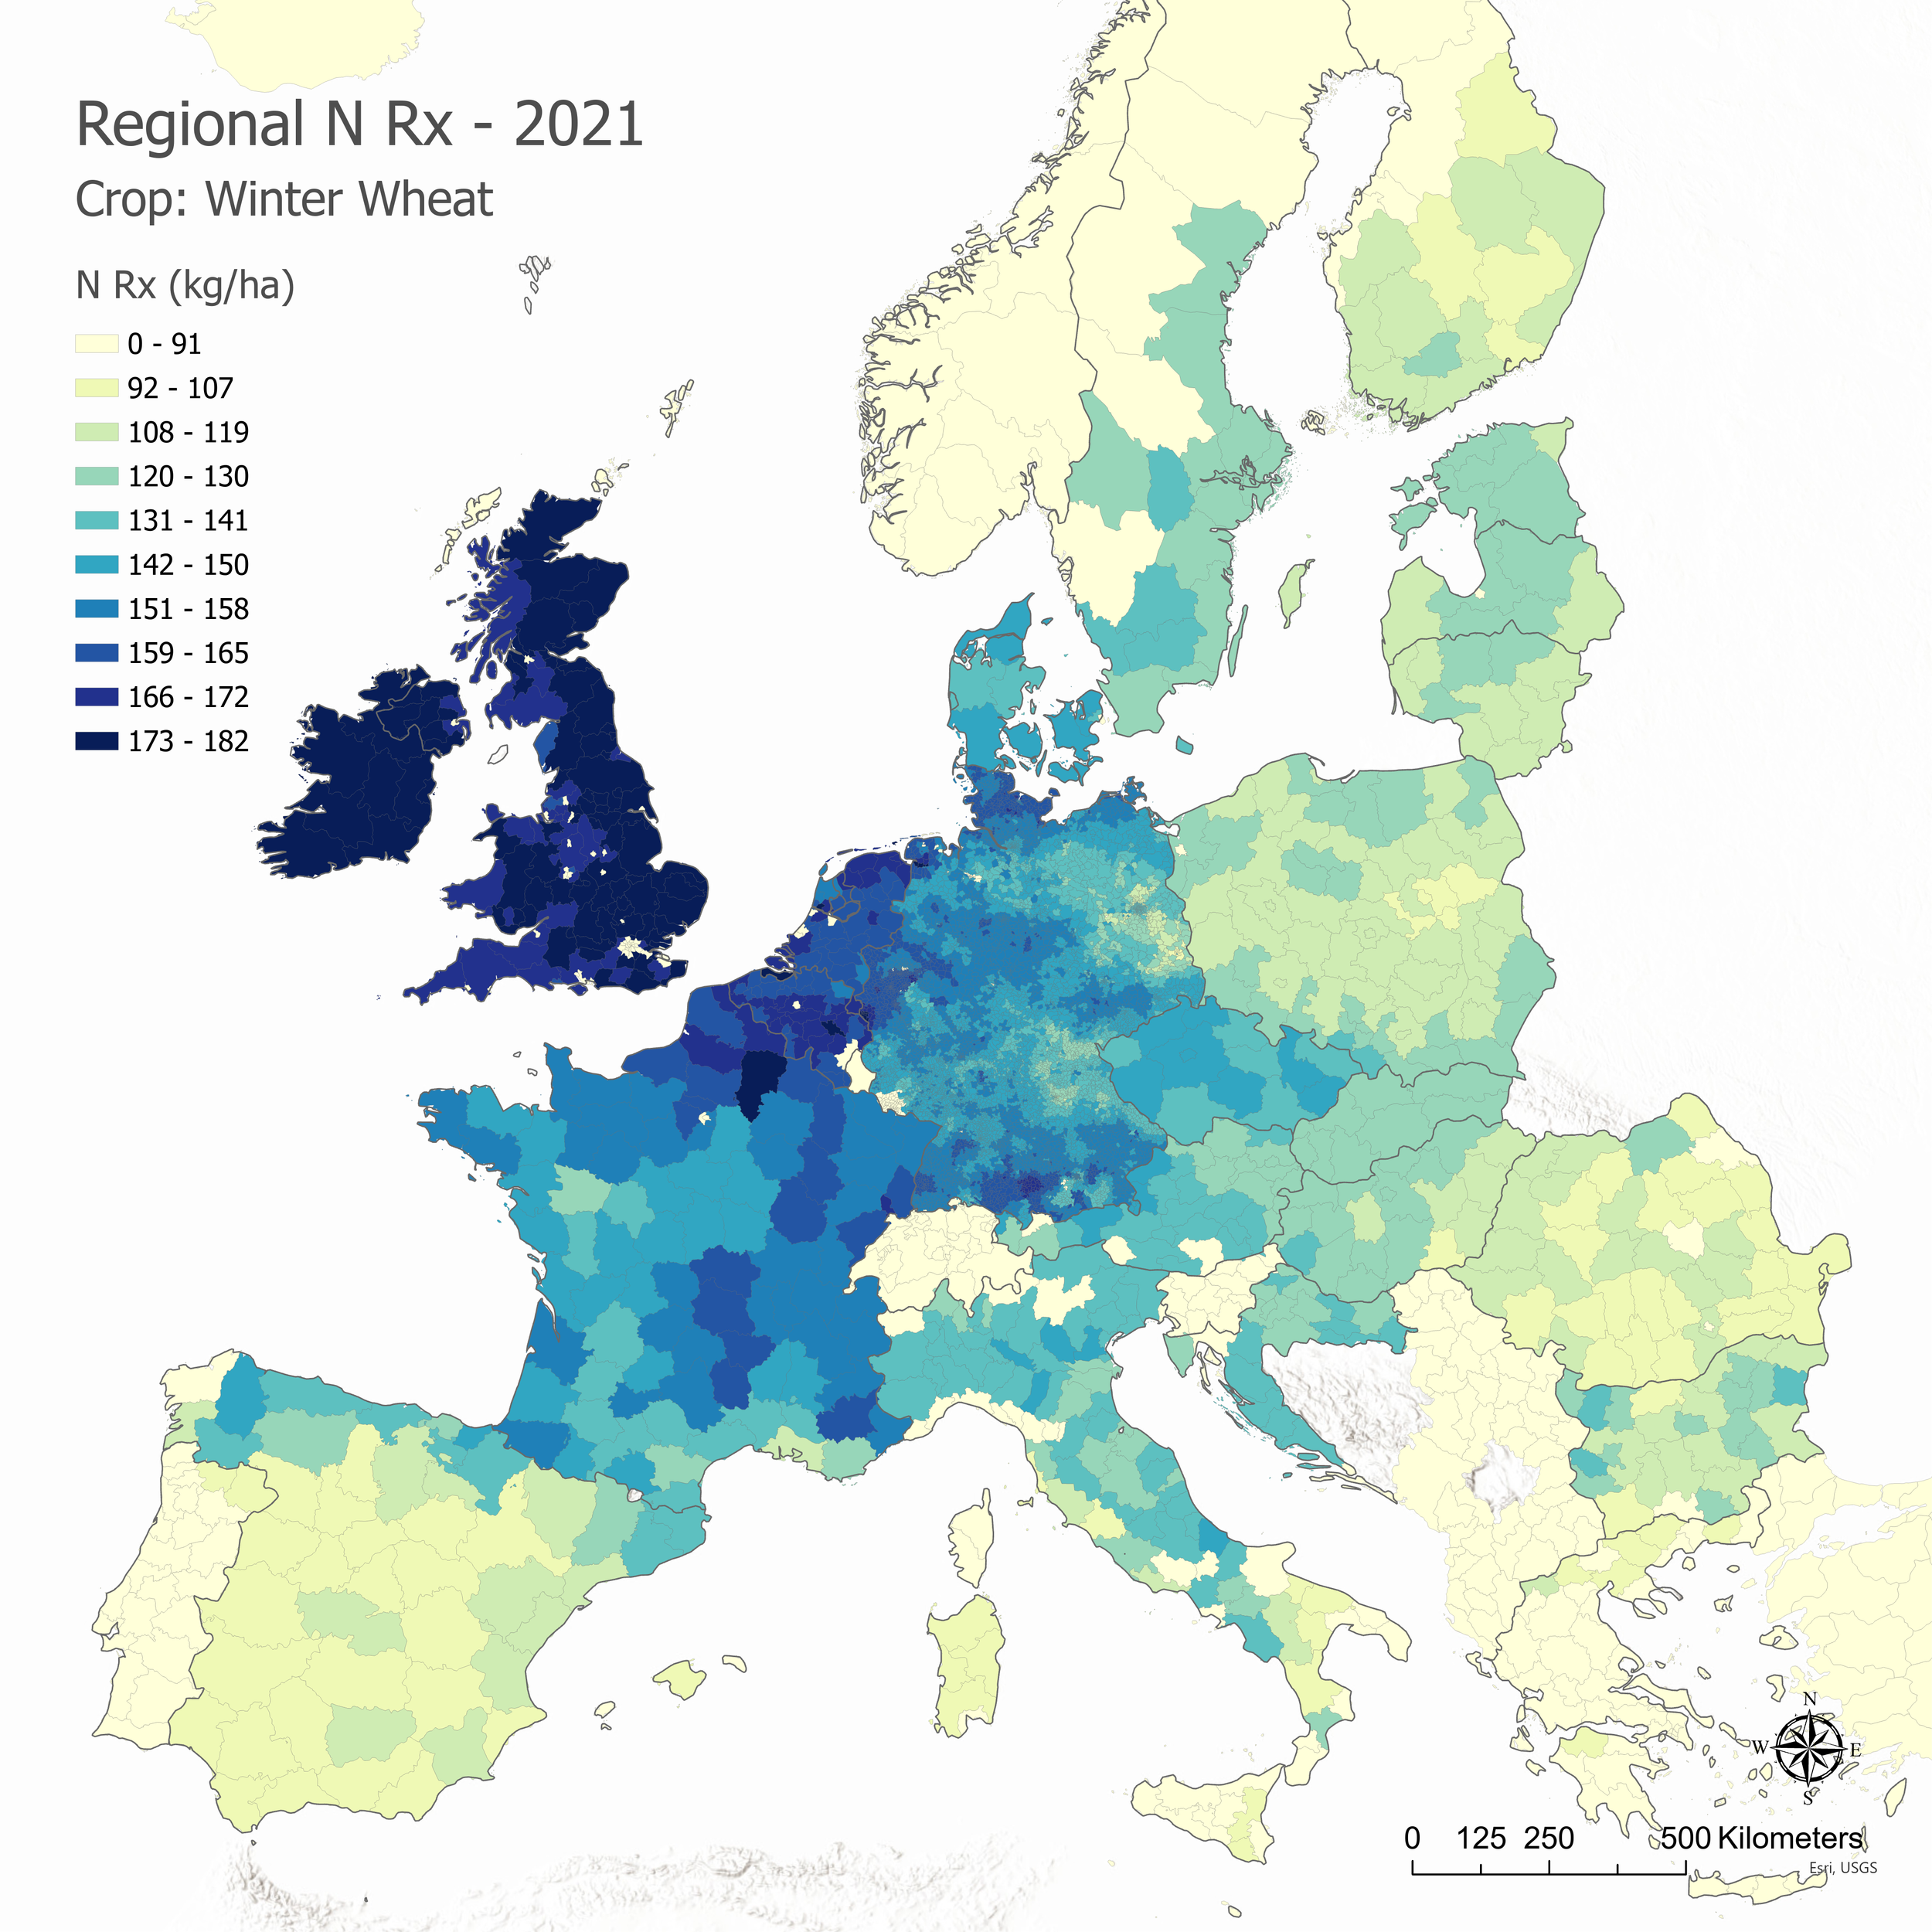
| Primary N₂O Emission Data | Verified primary farm-level N₂O emission data, replacing IPCC Tier 1 secondary emission factors. Each ANA recommendation generates a traceable primary data point that feeds directly into CSRD ESRS E1 Scope 3 Category 11 reporting and GHG Protocol LSR compliance from 2027. |
| API Output for Agribusiness Platforms | ANA recommendations delivered via API for integration into existing agribusiness CRM, farm management, or sustainability reporting platforms. Compatible with standard agtech data formats. |
| Regulatory Compliance Output | Recommendations formatted to comply with German Düngeverordnung nitrogen application limits. Reduces regulatory risk for farmers in nitrate-sensitive zones. Relevant for European harmonised nitrogen regulation expansion. |
WHO USES ANA
One tool. Three kinds of value.
Farmers & Agronomic Advisors
Save money on inputs today - without changing how you farm.
✓ Satellite-calibrated nitrogen maps per field zone — no sensors,
✓ Average +€28/ha additional profit through input optimisation
✓ Works with existing VRA equipment or as an agronomist advisory report
✓ Aligned with DüV nitrogen use - reduces compliance risk
✓ Zero upfront cost. Zero practice change required.
✓ Your verified practices can trigger regenerative payments.
Agribusinesses & Input Suppliers
Offer your farmer customers a digital precision service - without building a technology platform.
✓ API integration into existing farmer platforms and CRM systems
✓ Differentiate commodity fertiliser or input sales with a satellite advisory layer
✓ Deepen farmer relationships through year-round agronomic value
✓ First commercial step toward generating verified sustainability data from your supply chain
Food Retailers & CPGs
Engage your supplier farmers with a tool that saves them money - and generates the primary N₂O data your CSRD Scope 3 report requires.
✓ Zero-friction farmer onboarding: farmers benefit immediately, no compliance ask required
✓ Generates primary farm-level N₂O data to replace secondary IPCC emission factors
✓ Step 1 of the RegenScope3 programme: farmer engagement → SOC mapping → CSRD reporting
✓ Continuous supply chain monitoring - not an annual survey snapshot
Start where your farmers are.
Deploy ANA across your supplier farms. Farmers see savings immediately. Your supply chain builds the primary data infrastructure you need for GHG Protocol LSR and CSRD compliance - without a compliance-first ask.
-
No. Sentinel-2 imagery maps canopy variability across the field, and a geotagged smartphone photograph of the canopy calibrates that relative index into absolute nutrient values in kilograms per hectare. No sensors, no laboratory test and no in-field hardware are required.
-
No. ANA produces variable-rate nitrogen recommendations for existing VRA equipment, or an advisory report where there is none. There is no practice change and no upfront cost, and the average result is €28 per hectare of additional profit. Farmers never pay for ANA.
-
Every recommendation and application map is logged to the field record, producing primary farm-level nitrogen data in place of secondary emission factors. That matters because an application rate is asserted data unless something corroborates it, and an unverified figure propagates straight into a reported emissions number.