
Measuring nitrogen surplus from satellite: what German field data shows
Sustainability resists measurement because it is three things at once. This piece sets out a narrow, testable satellite proxy Spacenus built for German nitrogen - comparing crop demand against uptake to flag over-fertilisation at postcode scale, what it showed, where it fell short, and the MELODY project, started in May 2026 with TU Berlin, IIT Ropar and Agri Matrix India, now building a full composite sustainability index across six regions in India and Germany.
Why sustainability resists measurement
Ask three agronomists to define a sustainable farm and you will get three answers, all defensible. The standard framing has three dimensions — economic, environmental and social — and the practical difficulty is that they are measured in different units, respond on different timescales, and sometimes trade against each other.
Some academics argue that sustainability cannot be measured at all, because it is dynamic and site-specific. That position is intellectually respectable and operationally useless. Regulators, lenders, buyers and farmers all need to compare one field or one region against another, and in the absence of a defensible metric they will use an indefensible one.
The pragmatic response is to narrow the question until it becomes answerable, then be explicit about what you left out.
What we built first: nitrogen as a proxy
Our 2021 approach rested on a single assumption: a farm that fertilises accurately is likely to be doing several other things well. Fertiliser is roughly a third of input cost, so precision is economically rational. Over-application drives nitrate leaching and nitrous oxide emissions, so precision is environmentally material. And farms making data-driven nitrogen decisions tend to be making data-driven decisions elsewhere.
Nitrogen also has a practical advantage over every other candidate: it is detectable from orbit, everywhere, at low cost. Pesticide application is not reliably observable by satellite. Soil biology is not. Labour conditions certainly are not. Choosing nitrogen was partly a judgement about what matters and substantially a judgement about what can be seen.
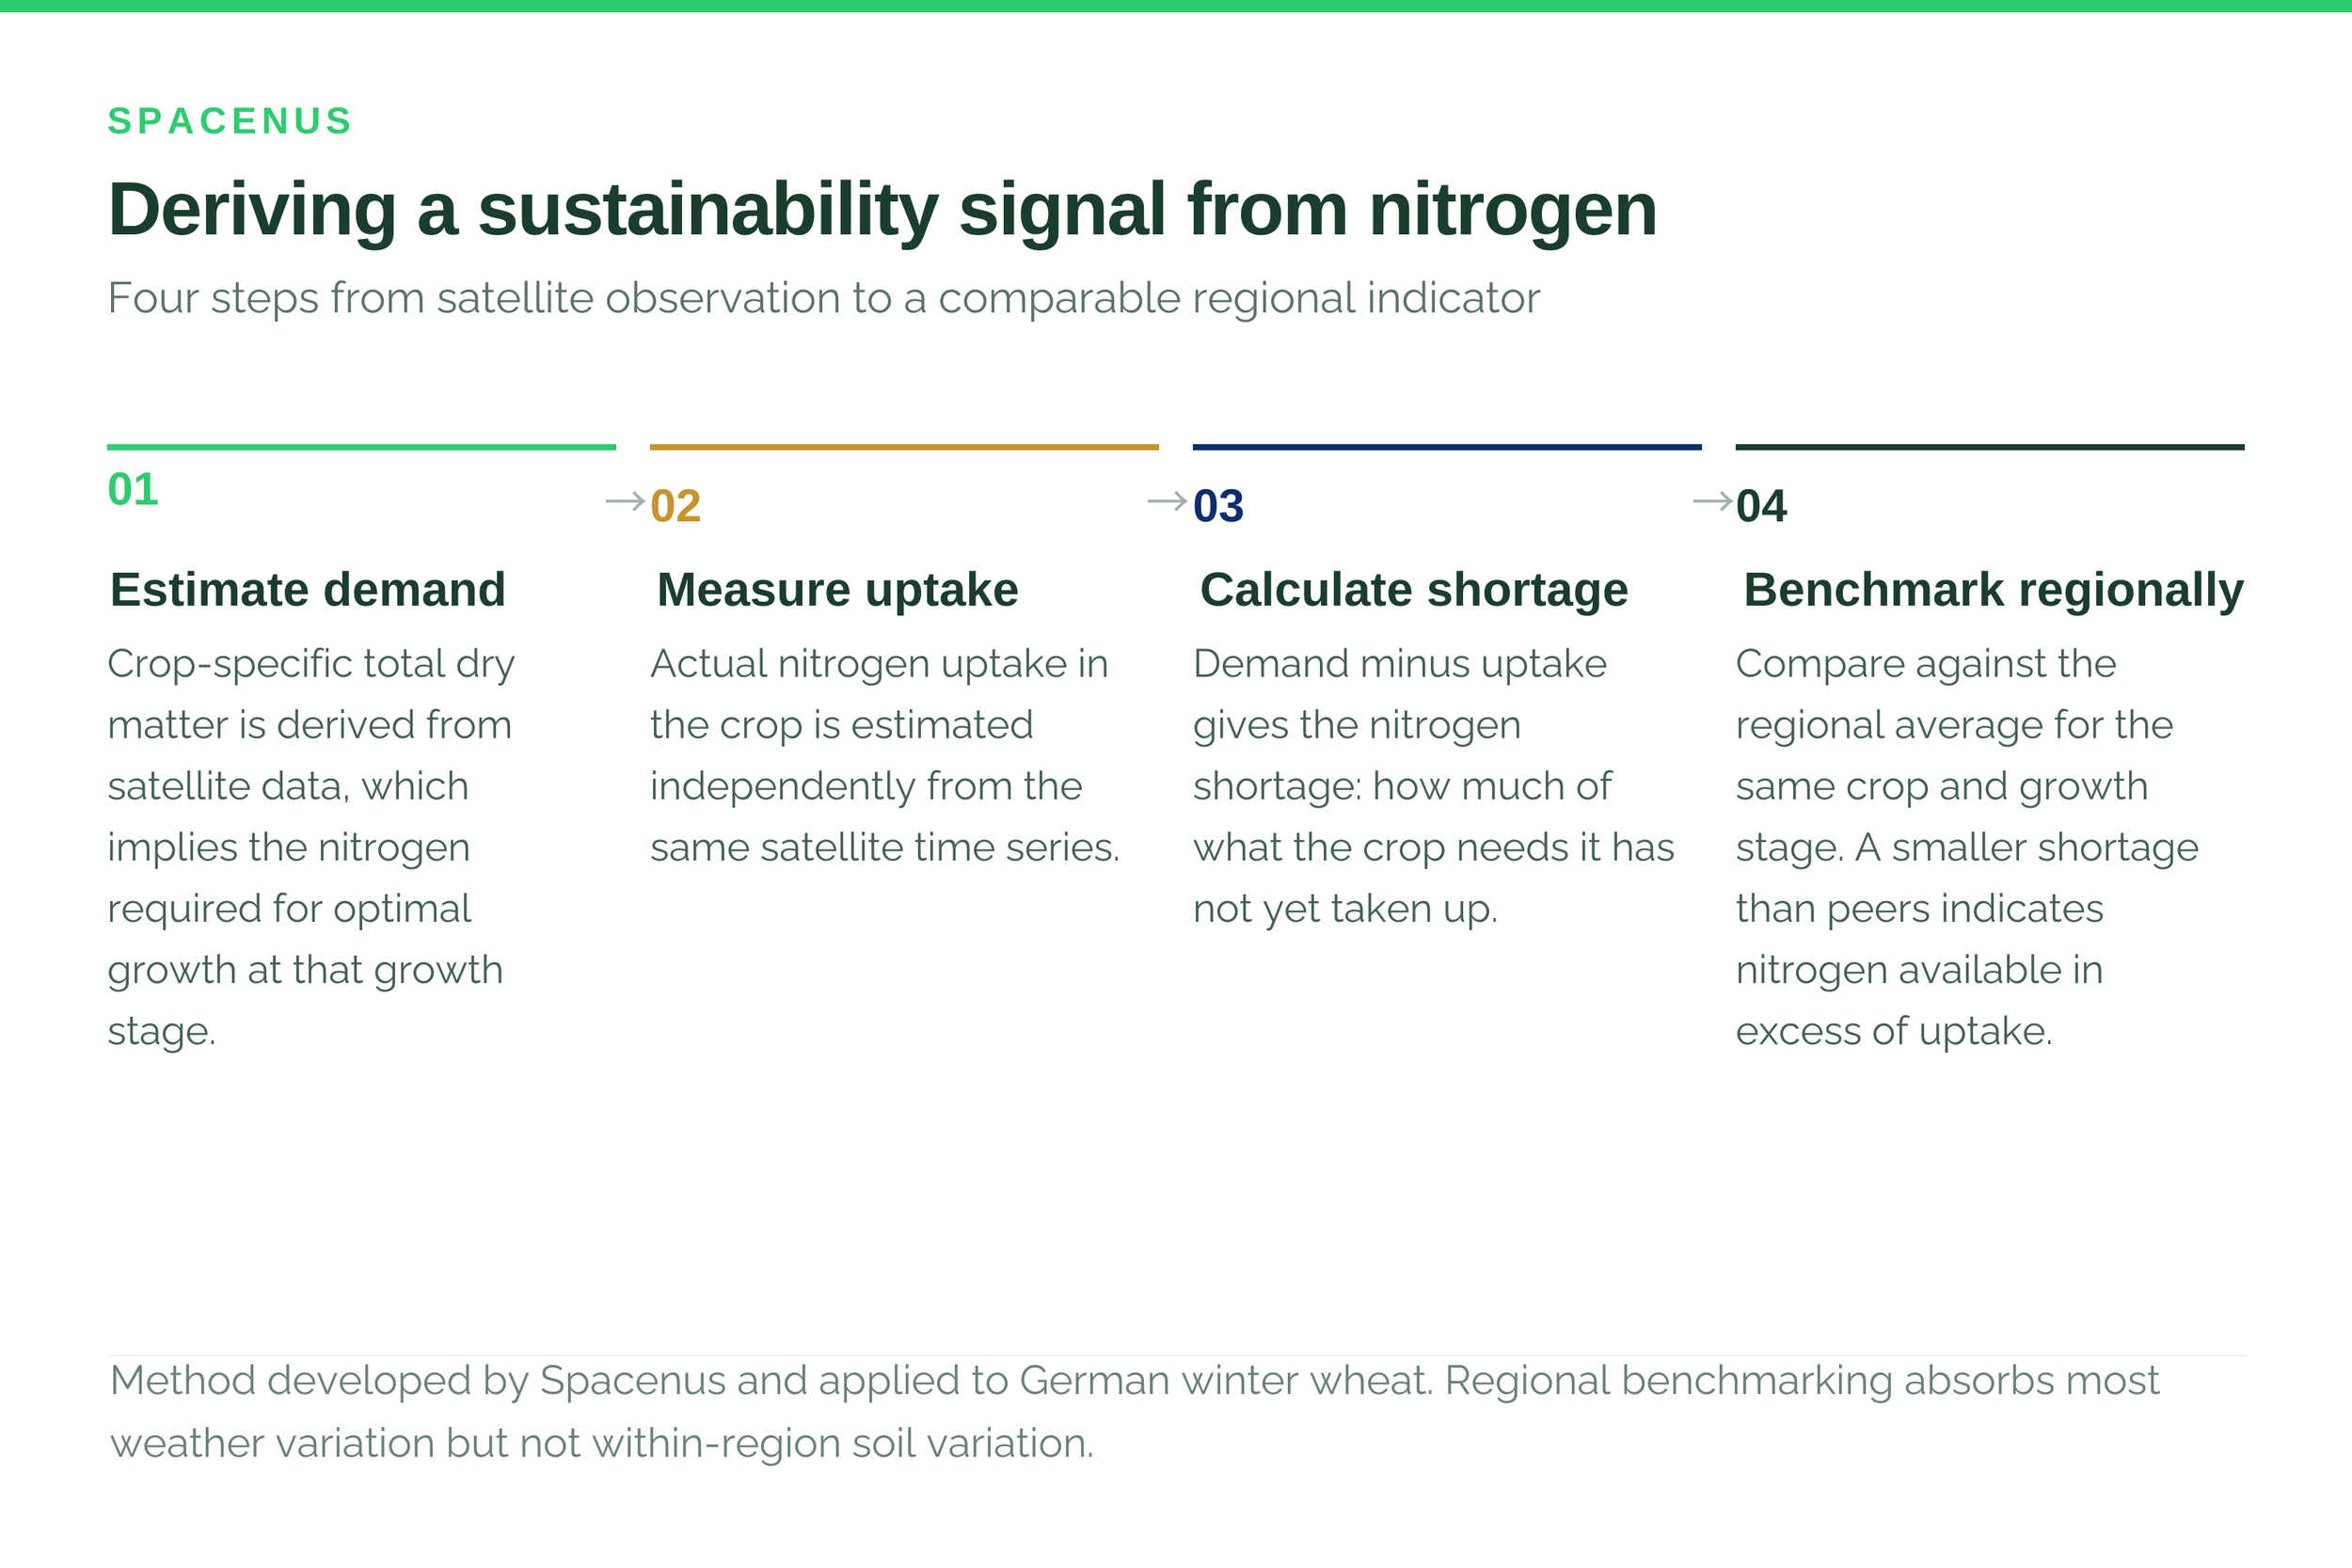
The method works in four steps. Satellite data gives crop-specific total dry matter, which implies the nitrogen demand for optimal growth. Satellite data separately gives actual nitrogen uptake. Demand minus uptake is the nitrogen shortage. Compare that shortage against the regional average for the same crop at the same growth stage, and the deviation is informative.
A field with a larger shortage than its regional peers is drawing down available nitrogen, broadly what optimal fertilisation looks like. A field with a smaller shortage has nitrogen readily available in excess of what the crop is taking up, which is what over-application looks like.
What it showed
Applied across German winter wheat and aggregated to postcode level, the picture was consistent: a substantial share of fields carried more nitrogen than the crop was using.
That finding is corroborated from an unrelated direction. Yield gap analysis for German wheat puts the gap at roughly 10–20%, meaning yields are already close to the achievable ceiling. If yields cannot rise much further, additional nitrogen applied in pursuit of them has nowhere useful to go.
The more provocative result concerned regulation. Germany manages nitrogen partly through designated red zones based on groundwater nitrate pollution. When we compared the over-fertilisation map against the red zone map, the correlation was weak. Nitrate pollution tracks livestock density more strongly than it tracks crop fertiliser overuse, which means red zones are a reasonable proxy for one problem and a poor instrument for regulating a different one.
Farmers we spoke to were not objecting to nitrogen limits in principle. They were objecting to being given the same number as a neighbour whose fields behave differently. A map showing which fields are actually over-applied allows the rule to be specific, and a specific rule is easier to defend to the person it applies to.
What it did not do
Three limitations, stated plainly because the original version of this article under-stated them.
One dimension, one nutrient. Nitrogen efficiency is a partial view. It says nothing about water, biodiversity, soil biology, pesticide use or anything social.
Confounders. Weather and soil type both affect nitrogen uptake. Benchmarking against a regional reference absorbs much of the weather effect, because neighbouring fields experience the same season. It does not absorb soil variation within a region.
One country, one crop system. German winter wheat is a well-documented, uniform, large-field system. Nothing about the method’s performance there predicts how it behaves on a two-hectare rice plot in Chhattisgarh.
What we are building now: the ASK tool
In May 2026 we started a three-year project addressing all three limitations. MELODY, Machine Learning and Remote Sensing Synergy for Sustainable Crop Production, runs under the Indo-German Science and Technology Centre 2+2 programme, which pairs academic and industrial partners from both countries.
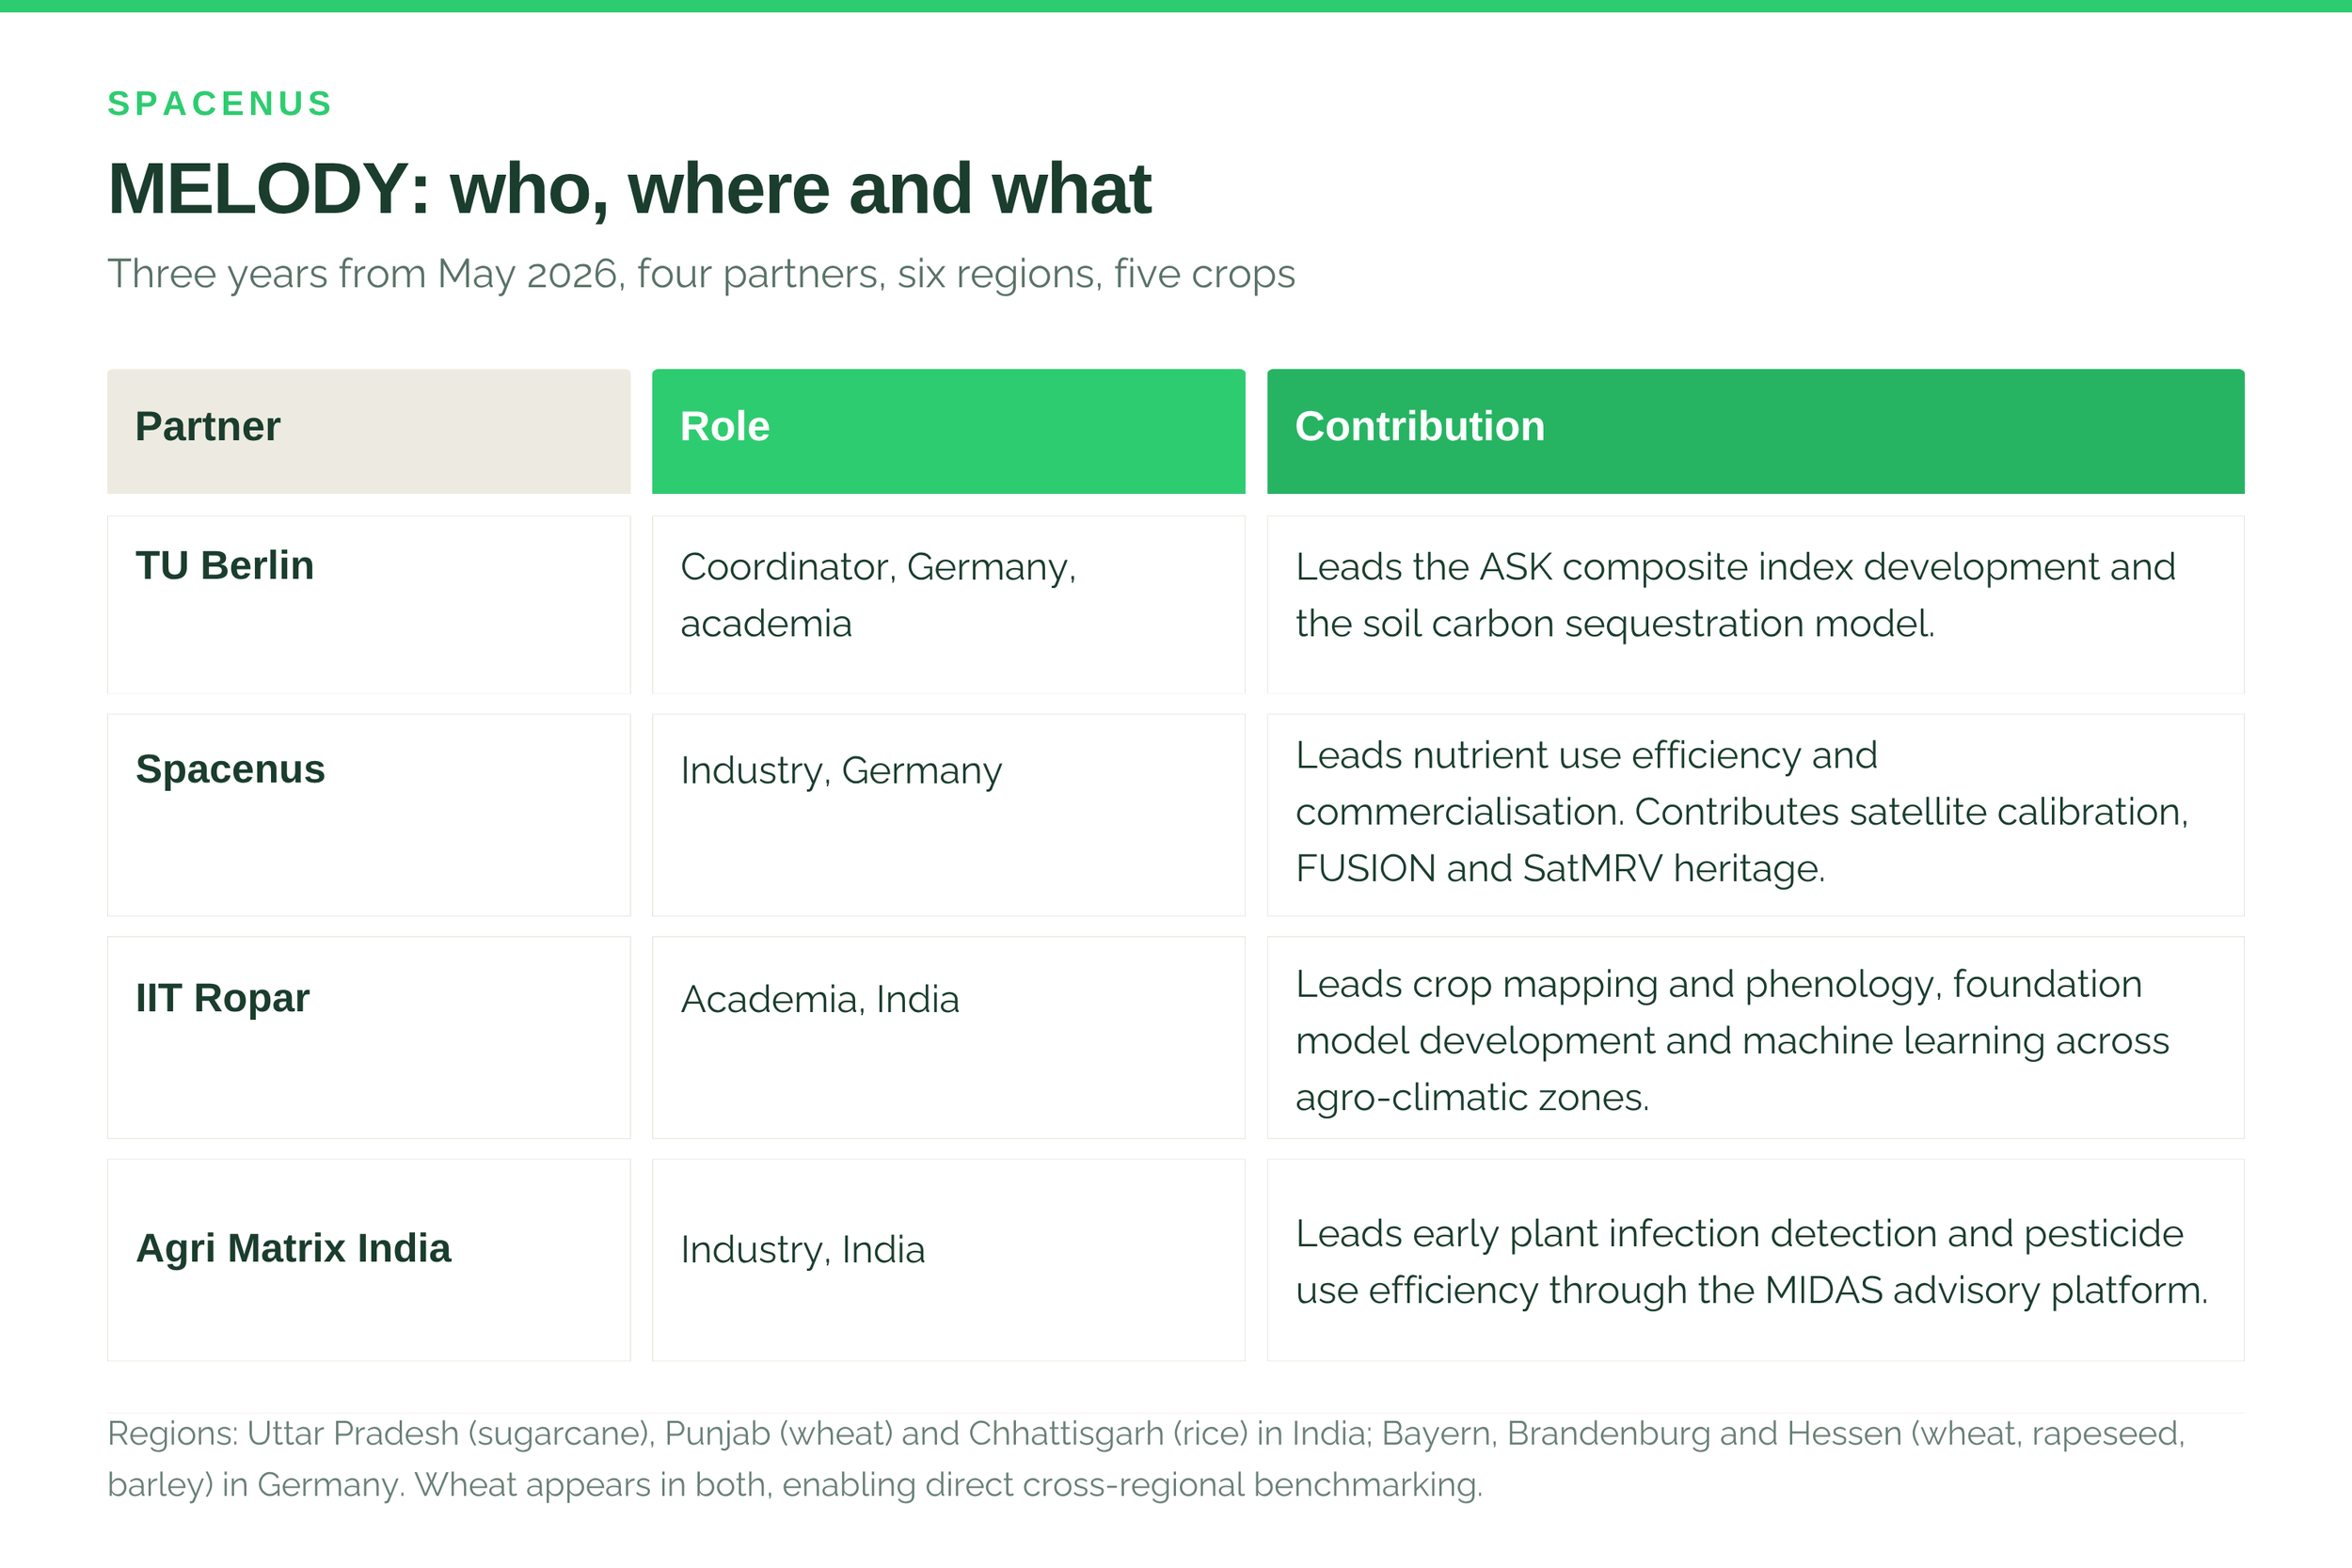
The consortium is TU Berlin as coordinator, Spacenus, IIT Ropar and Agri Matrix India. Spacenus leads the nutrient use efficiency work package and the commercialisation work package, and contributes to the soil carbon sequestration model.
The output is the ASK tool - an Agricultural Sustainability Key Performance Indicator. Where the 2021 work produced one environmental indicator for one country, ASK combines three families of indicator across six regions and five crops.
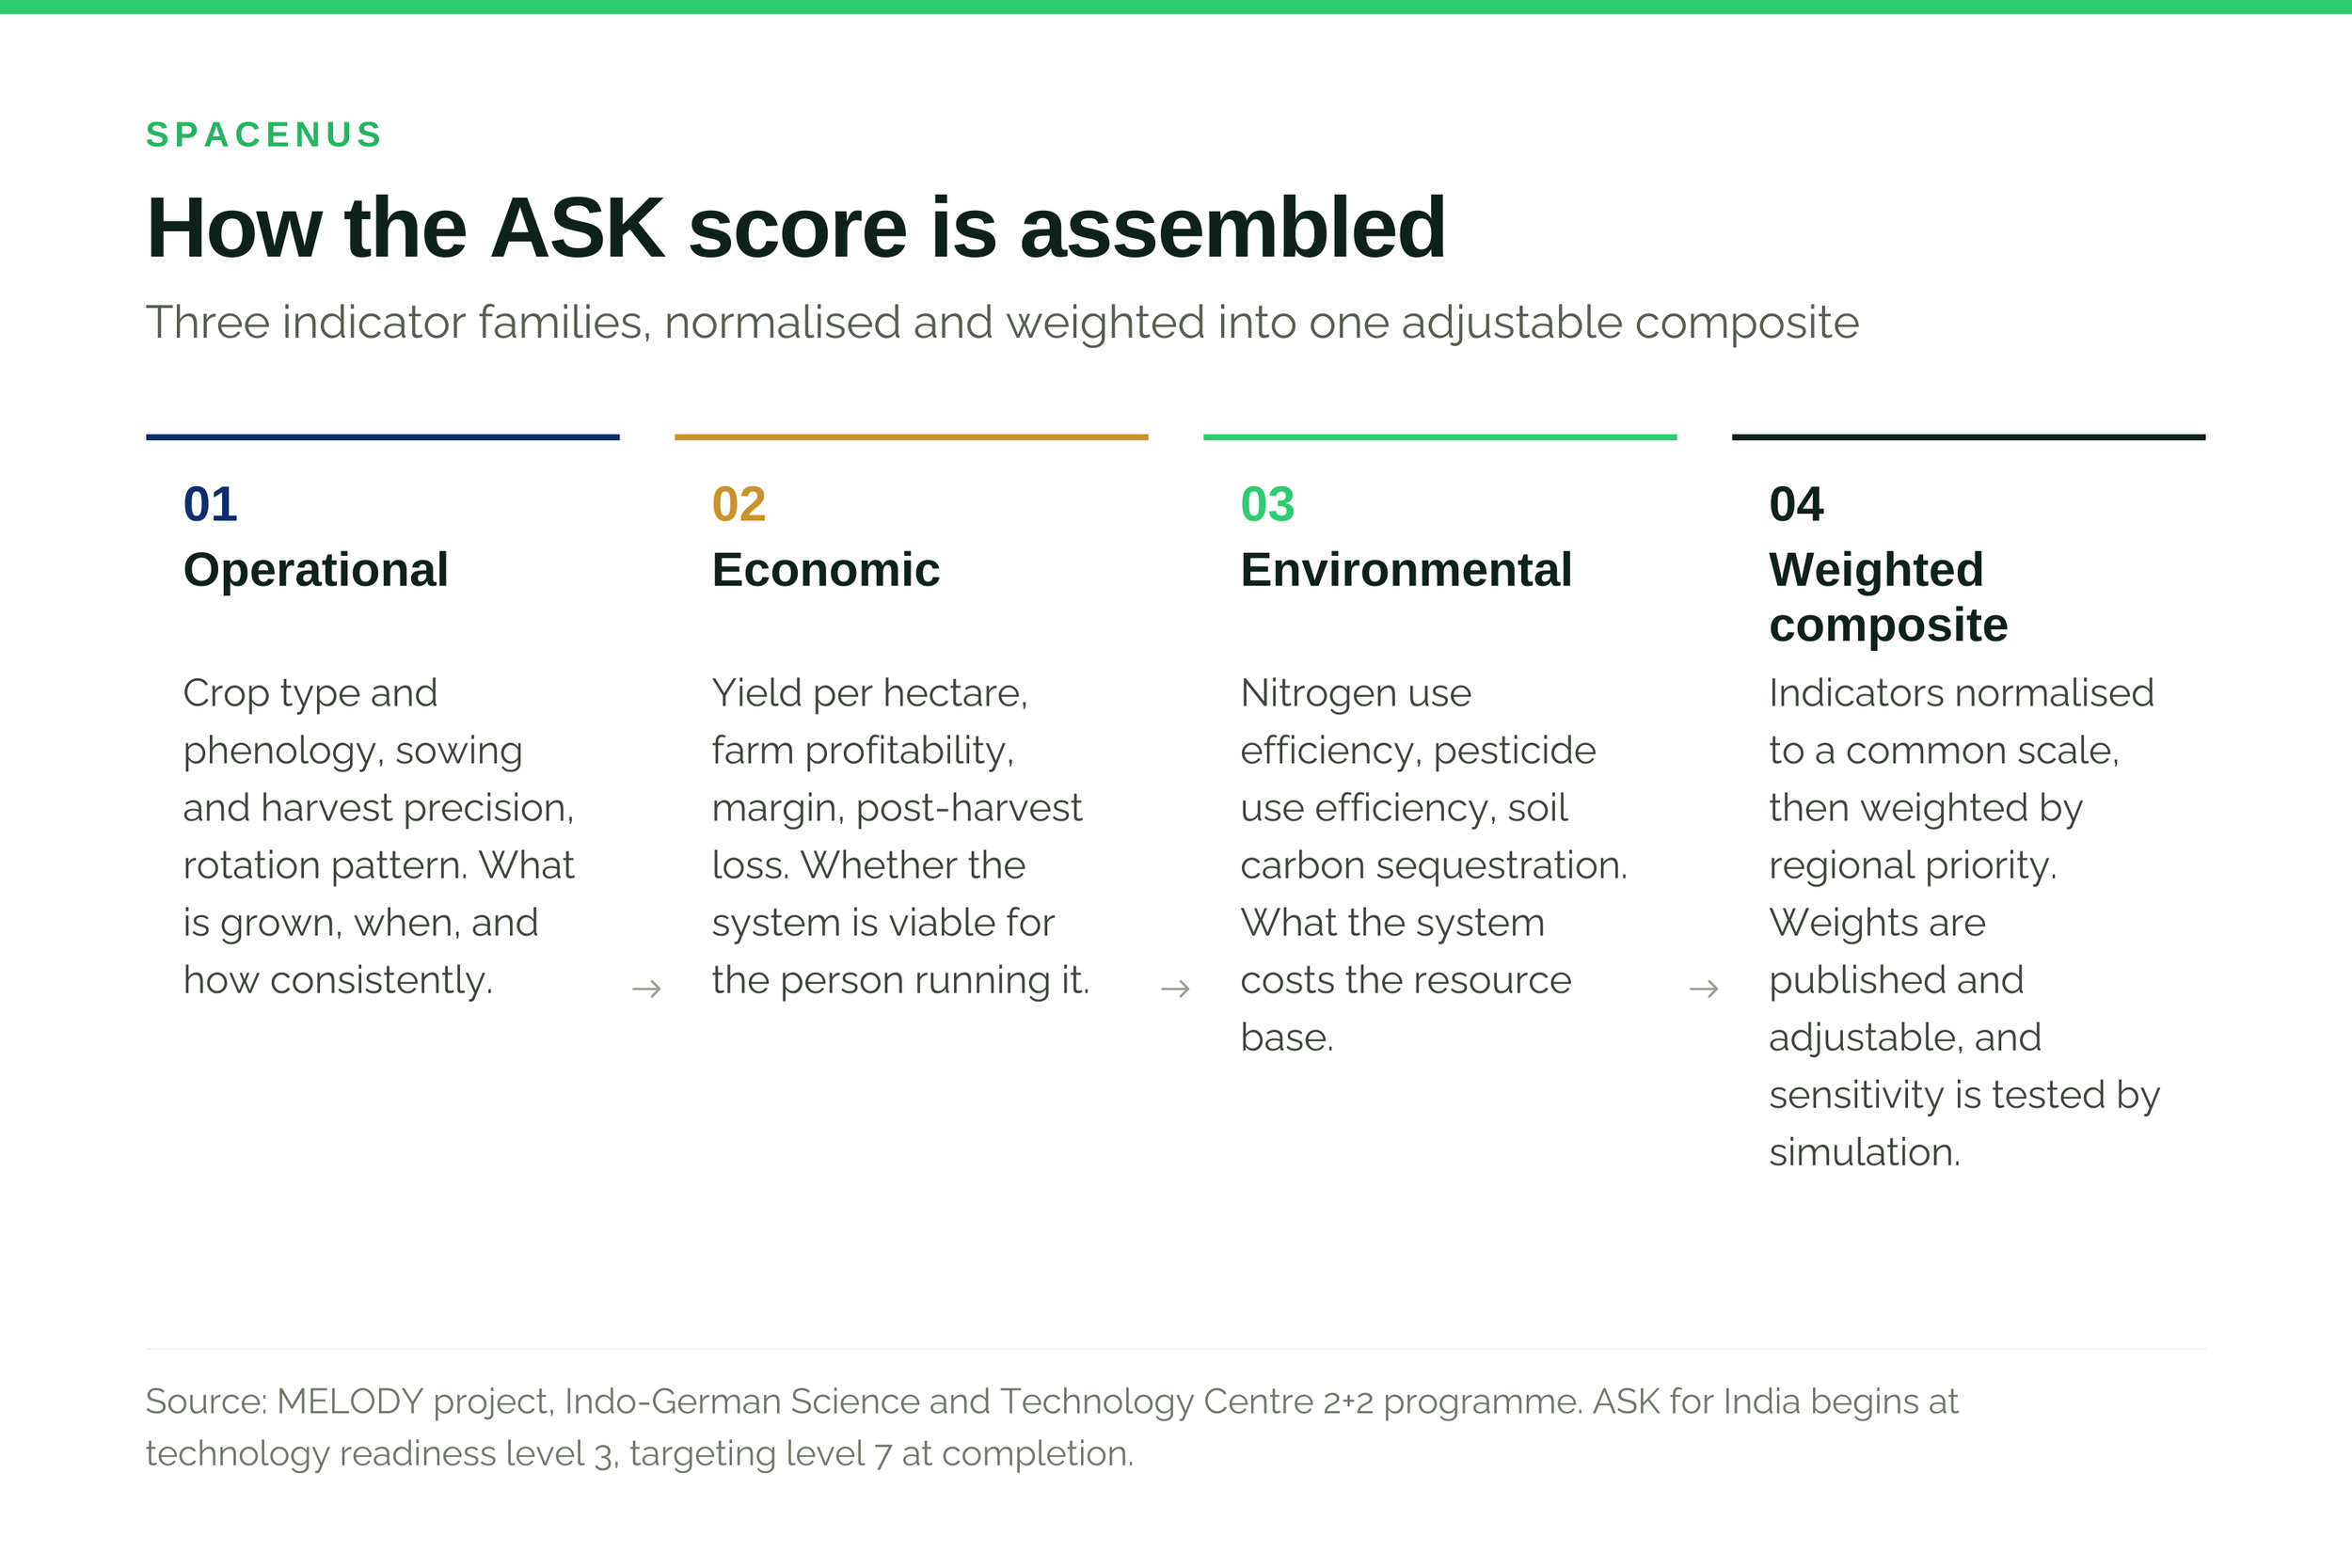
Operational indicators. Crop mapping, phenology, sowing and harvest precision, rotation patterns, what is being grown, when, and how consistently.
Economic indicators. Yield per hectare, profitability, post-harvest loss.
Environmental indicators. Nitrogen use efficiency, pesticide use efficiency, soil carbon sequestration.
Geographically the project covers Uttar Pradesh for sugarcane, Punjab for wheat and Chhattisgarh for rice on the Indian side, and Bayern, Brandenburg and Hessen for wheat, rapeseed and barley on the German side. Wheat appears in both, which makes direct cross-regional benchmarking possible.
The hard part is not the satellite data
It is the weighting. A composite index requires normalising indicators onto a common scale and then deciding how much each one counts. That second step is a value judgement wearing technical clothing, and it is where most sustainability indices quietly lose their credibility.
Weight nitrogen efficiency heavily and intensive arable systems score badly. Weight yield per hectare heavily and they score well. Neither weighting is objectively correct, they encode different views about what agriculture is for.
The project’s approach is to make the weighting explicit and adjustable rather than to pretend a neutral answer exists: regions facing acute nitrogen problems can weight environmental indicators more heavily, regions where farm viability is the binding constraint can weight economic ones. Validation runs through Monte Carlo simulation to test how sensitive the score is to those choices, which is the honest way to handle a subjective parameter, quantify how much it moves the answer.
“A single sustainability number is only as trustworthy as the argument for its weights. Publish the weights, show how much the score moves when you change them, and let people disagree with you in the open.” — Spacenus team
Who would use it
The obvious users are policymakers deciding where to target intervention, and agribusinesses assessing supplier regions. Two less obvious ones are more commercially interesting.
Agricultural finance. Lenders and insurers pricing farm risk currently have very little forward-looking information about land condition. A defensible sustainability score is directly relevant to credit and insurance decisions, and the project explicitly examines these applications.
Land valuation. Agricultural land is priced largely on yield history and location. A measure of whether the underlying resource is being maintained or depleted is material to what the asset is actually worth, and satellite history makes it assessable without site visits.
Where it stands
The ASK tool for India begins at technology readiness level 3 and the project targets level 7, a validated prototype in an operational environment, not a commercial product. First outputs are a time-series agricultural database and validated nutrient models for Indian wheat, sugarcane and rice.
We will publish results as they come, including the ones that do not work. A sustainability index that only ever reports success is not measuring anything.
The nitrogen analysis described here runs on the same satellite calibration engine as ANA, our nitrogen recommendation product. MELODY is funded under the Indo-German Science and Technology Centre 2+2 programme with TU Berlin, IIT Ropar and Agri Matrix India.
Common questions
Can agricultural sustainability really be reduced to one number?
Not without losing information. The argument for a composite index is not that it captures everything, but that decisions get made regardless and an explicit, published, adjustable metric is better than an implicit one. The weights should always be visible.
Why use nitrogen as the primary environmental proxy?
Because it is economically significant, environmentally material, and - unusually among sustainability variables, reliably observable from satellite at scale and low cost. Pesticide use and soil biology are arguably as important and are not remotely detectable with comparable reliability.
What is the ASK tool?
An Agricultural Sustainability Key Performance Indicator combining operational, economic and environmental indicators into a single adjustable score, under development through the MELODY project across six regions in India and Germany.
When will it be available?
MELODY runs for 36 months from May 2026. The target is technology readiness level 7, a validated prototype, by completion, with intermediate outputs including nutrient models and a time-series agricultural database released earlier.